By now we hear about greenhouse gases and their emissions on a daily basis. But what exactly are greenhouse gases? And who pollutes the most by emitting them?
By now we hear about greenhouse gases and their emissions on a daily basis. But what exactly are greenhouse gases? And who pollutes the most by emitting them? Greenhouse gases are those gases present in the atmosphere that let through much of the radiation that reaches the Earth from the Sun, but partially trap the infrared radiation emitted by the Earth itself. This is where the so-called greenhouse effect originates.
What the greenhouse effect is
Greenhouse gases can result from natural processes (e.g. water vapour), from both natural and artificial processes, such as carbon dioxide (CO2) and methane (CH4), or from artificial processes alone, as in the case of fluorinated gases. In the phenomenon of global warming, however, the prime ‘suspect’ is carbon dioxide, which accounts for over 75 per cent of human-caused emissions and is indeed chiefly responsible for the rise in the planet’s temperature.
Show moreShow less
It is a natural phenomenon that regulates the planet’s temperature and therefore makes life on Earth possible. The fact is that human activity has become responsible for an unnatural increase in the greenhouse effect, with a resulting rise in temperatures. This is the main cause underlying global warming. But which activities generate this effect?
One might ask what percentage of the greenhouse effect is of natural origin and what percentage of artificial origin. The estimates are in fact not unanimous; but it is now a fact established by science that human activity is the main cause of the phenomena leading to global warming. It is therefore an unavoidable and logical necessity to focus on the composition and sources of greenhouse gas emissions of human origin. Obviously, as human beings, we can only act on this part of the problem, whatever its extent may ultimately be.
The sectors that produce greenhouse gases
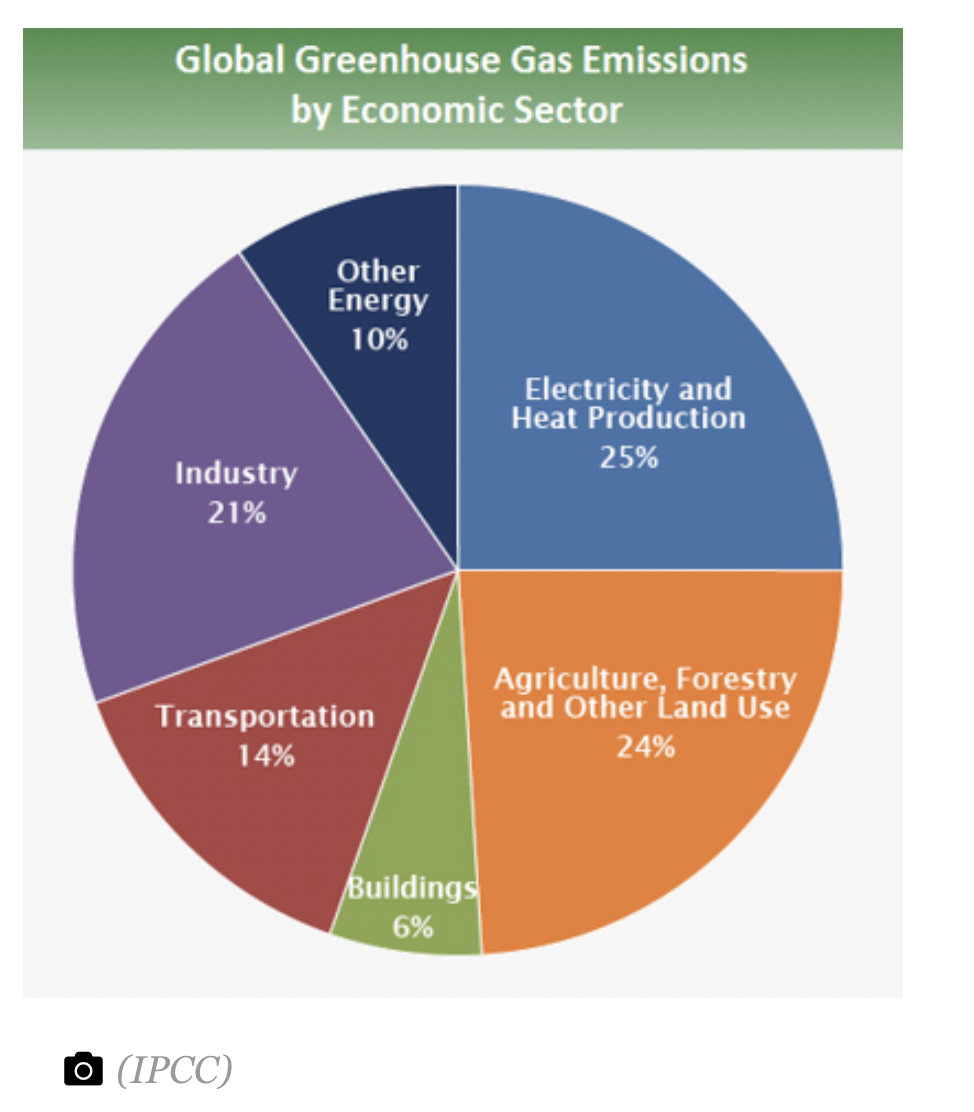
Assessments of the impact of different sectors on total greenhouse gas emissions are complex and vary depending on the parameters considered. The estimates of the IPCC (the Intergovernmental Panel on Climate Change, formed in 1988 by the United Nations to study global warming), based on 2010 data, give this breakdown:
25 per cent comes from electricity and heat production, from burning coal, natural gas or oil; 24 per cent from agriculture, livestock farming and deforestation; 21 per cent from industry; 14 per cent from transport; 6 per cent from the consumption of fossil fuels for residential and commercial use; 10 per cent from other activities: the extraction of fossil fuels, oil refining, its processing and its transport.
IPCC
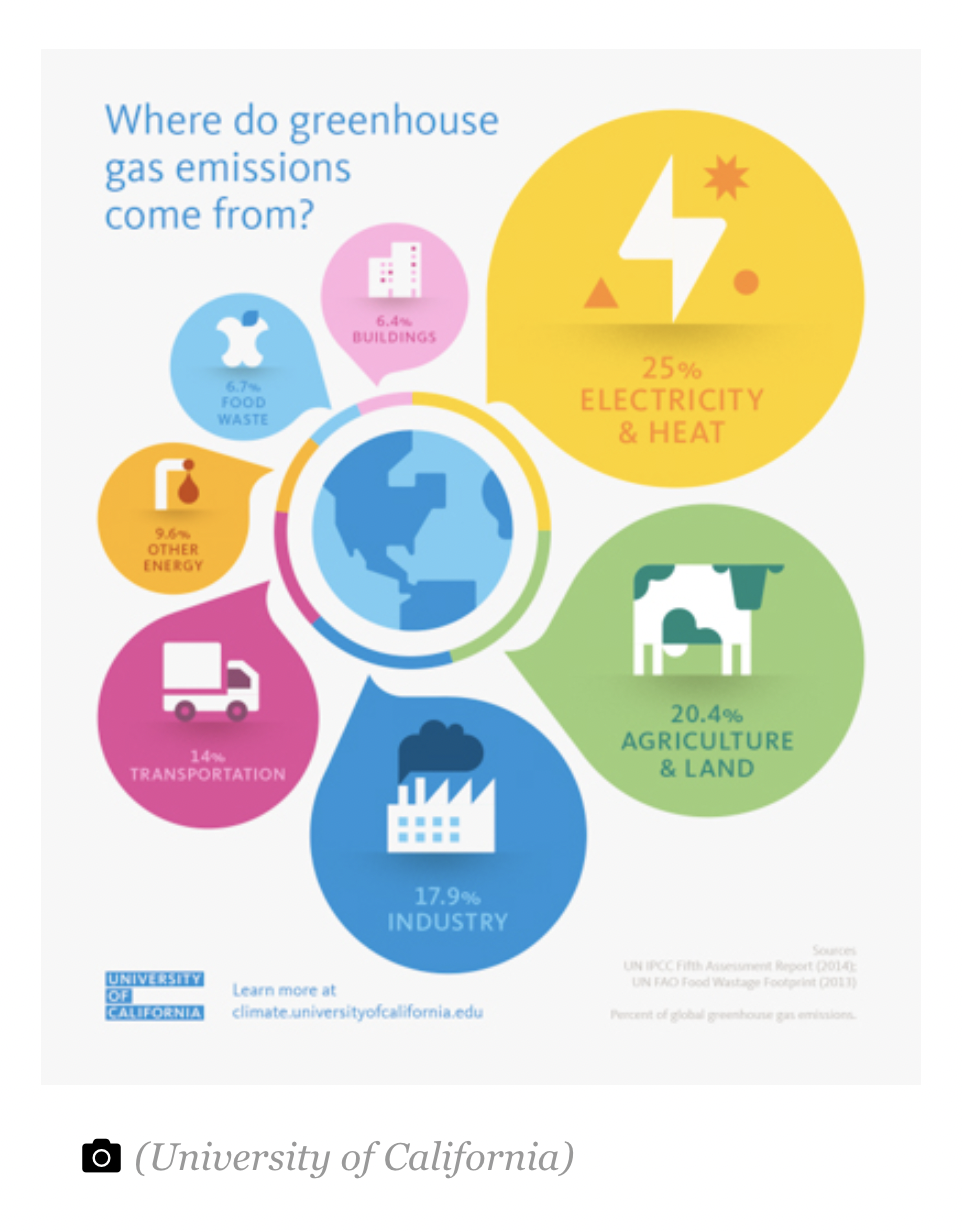
The University of California, for its part, also took into account in its estimate the emissions from the production of food that is then wasted. This amounts to 6.7 per cent of global emissions.
University of California
It should also be noted that the data can be grouped in different ways: the figure for electricity, for example, can be more or less allocated to the sectors of human activity that use it, from transport to industry to homes.
If we take the case of the USA, redistributing the emissions from electricity production across the various sectors gives a different chart. The sector with the most emissions becomes, at 31%, that of homes and commercial establishments; industry becomes the second sector, at 30%, followed by transport at 29% and energy at 10%.
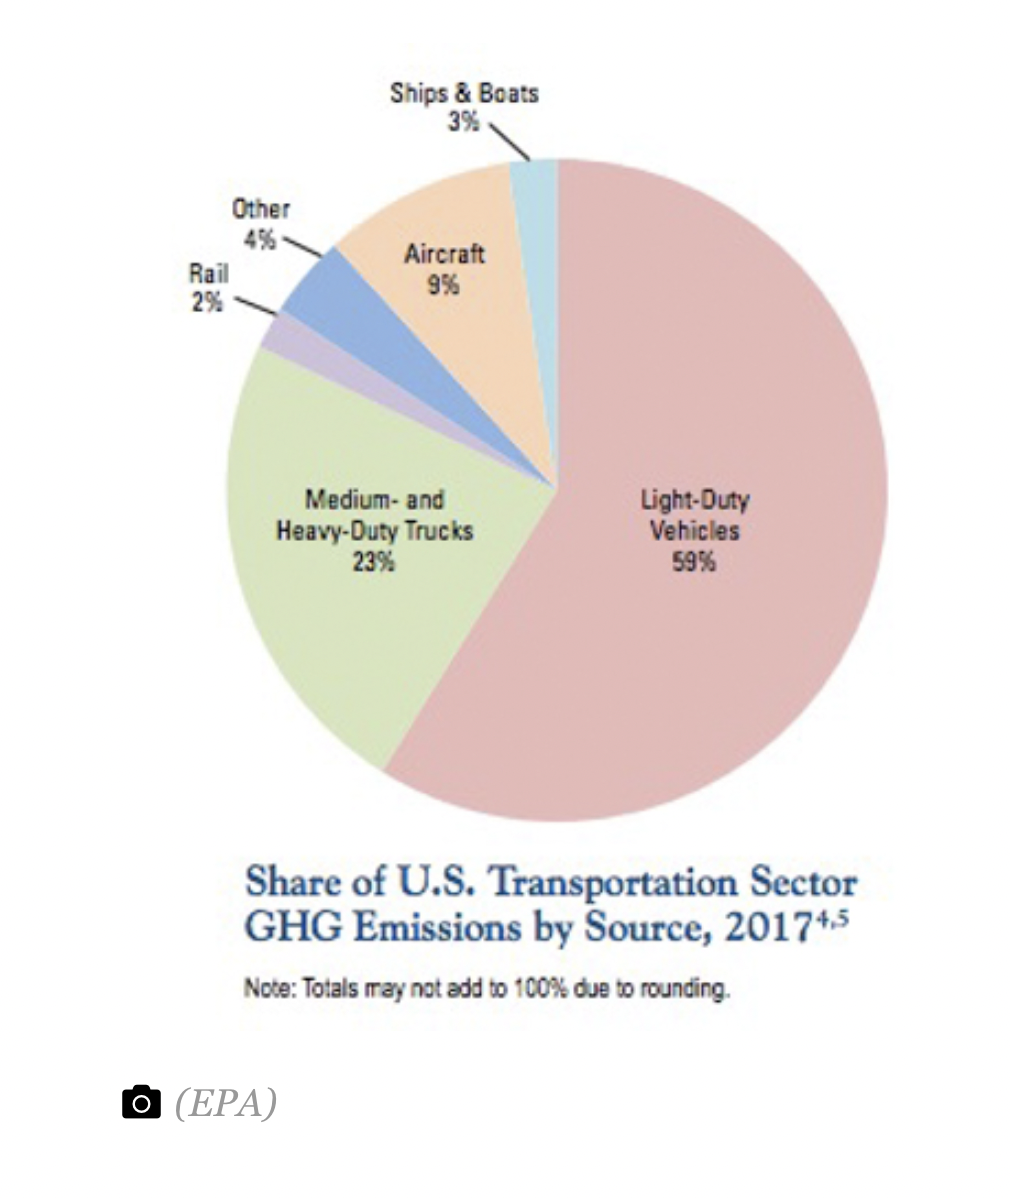
EPA
Transport
Estimates for the transport sector are not unanimous. If we take the United States, we find that the breakdown is as follows: 59% of emissions are caused by cars, vans and small trucks; 23% by medium and heavy trucks; 9% by aircraft; 3% by boats and ships; 2% by trains; 4% by other means of transport.
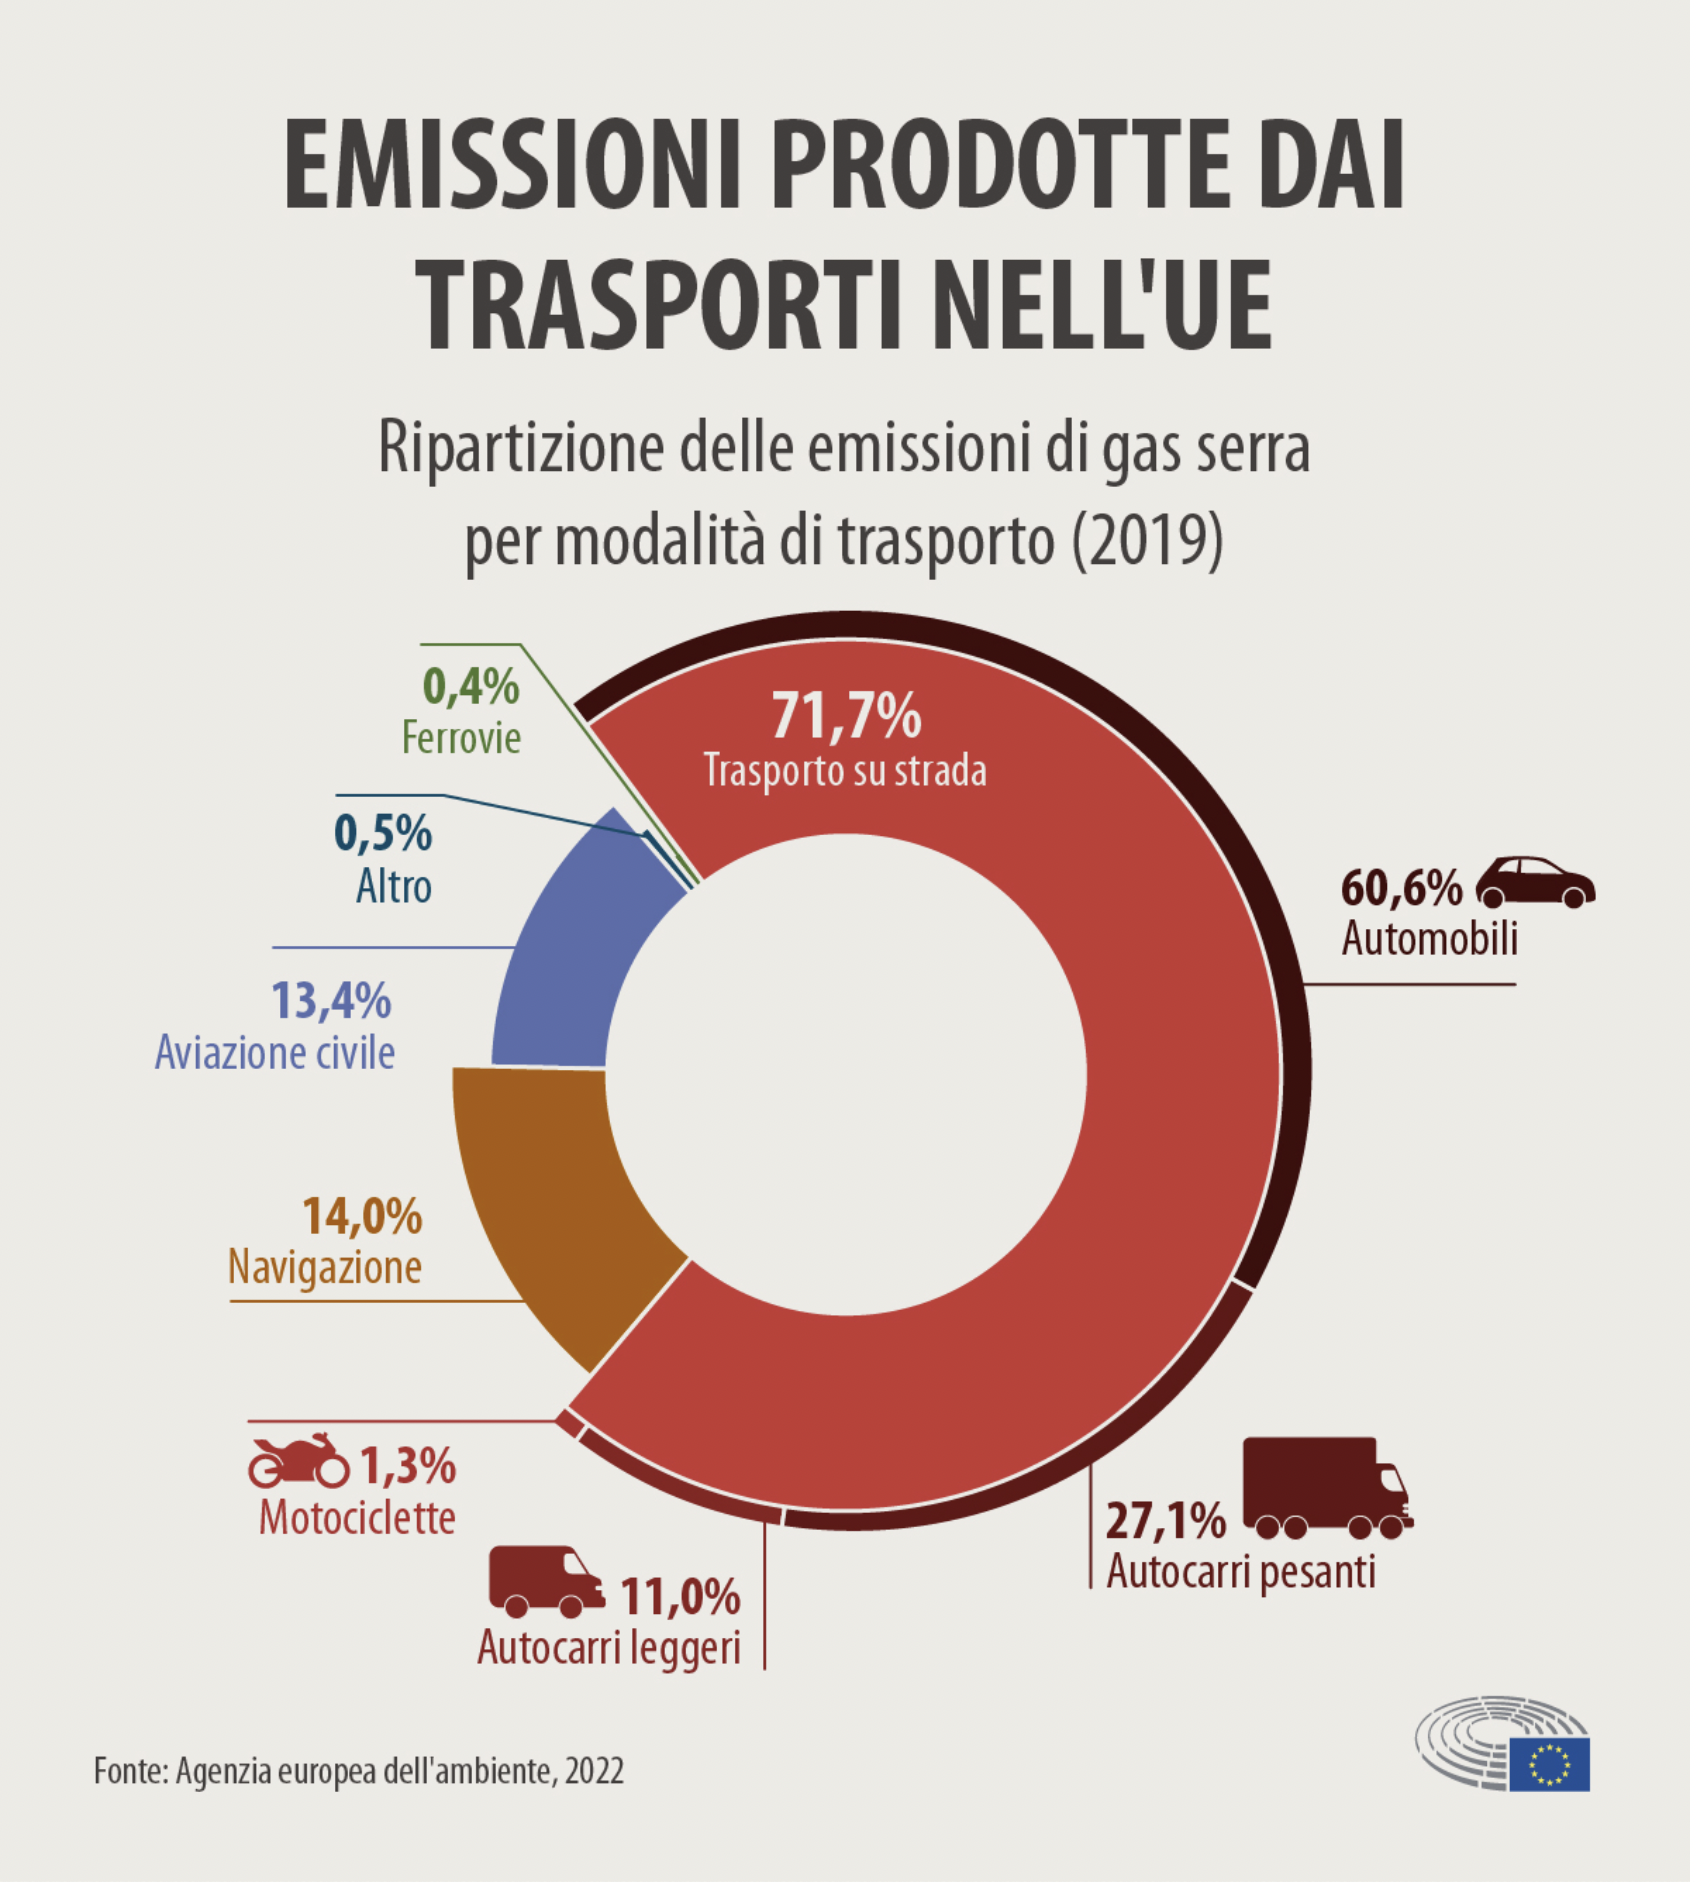
In Europe, the transport sector, according to the EEA (the European Environment Agency), is responsible for about a quarter of total CO2 emissions in Europe, 71.7% of which is produced by road transport. Here is the breakdown chart, again according to this source:
European Environment Agency
Agriculture, livestock farming and deforestation
According to FAO estimates, livestock farming contributes more than 14% of total human-caused greenhouse gas emissions. The largest share by far, namely 65%, comes from cattle farming, both for meat and for milk (beef farming has almost double the emissions of dairy farming).
Next come pig farming with 9%, buffalo with 8%, chickens and hens with 8%, and sheep, goats and other species with 6%. Emissions linked to livestock farming are caused mostly by feed production and by the animals’ digestion. The greenhouse gas most produced by livestock farming is methane (44%), followed by nitrous oxide and carbon dioxide, both below 30%.
Land use also obviously affects emissions: plants and soil store carbon, removing it from the atmosphere. It is well known that in the United States, from 1990 to the present, there has been a large-scale conversion of farmland into grassland and forest, so that overall the land and forest use sector has helped to reduce carbon dioxide emissions. However, the same does not happen in many other parts of the world.
Emissions around the world
And so we come to the ever hotly debated subject of the distribution of emissions by country, that is, who the biggest ‘culprits’ are. It is well known that, in absolute terms, the main global emitter is China, with about 28% of total emissions. In second place are the United States, with 15%, followed by India with 6%, Russia with 5% and Japan with 4%. The 28-country European Union accounts for 9%, with its 15 most industrialised countries reaching almost 7.5%. Italy has emissions slightly below 1%, like France.
Of course, the global figure, which does not take the number of inhabitants into account, is of limited relevance, to say the least, for a proper assessment. China has 1.5 billion people, the United States about 330 million. It is therefore important to consider per capita emissions as well.
At the top of this unenviable ranking are the oil-producing countries of the Middle East, with Kuwait in the lead (with over 50 tonnes of carbon dioxide per capita per year). At the top of the ranking we also find other small or very small states such as Brunei and Belize. The first large country is Australia, with 25 tonnes per capita per year. Canada and the USA follow close behind with 21 and 20 tonnes. In this list China is much lower down: its inhabitants cause on average the emission of 8.4 tonnes of CO2 per capita. Italy is estimated at about 7 tonnes per capita. Germany is at 11.
Was it useful? Pass it on to someoneSharing an investigation is worth more than a like.